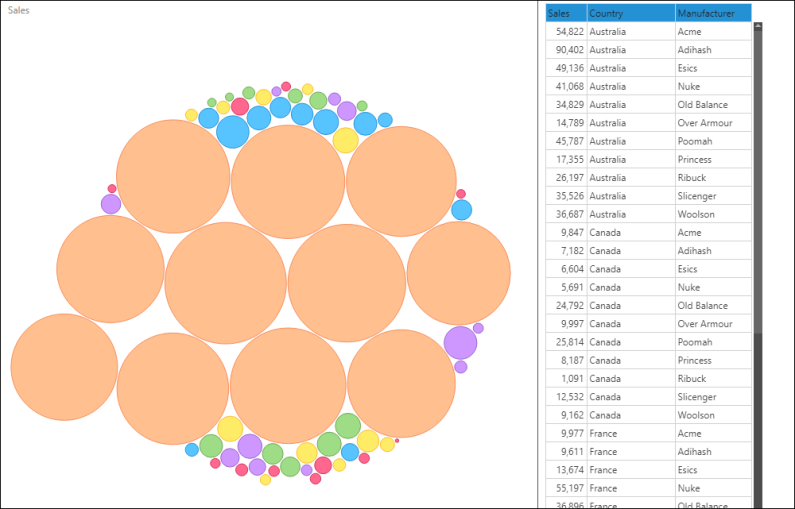
Users can show the underlying raw query data beside or beneath the visualization. This provides a useful way to simultaneously examine both trends in the data, and the raw data itself. Use the Show Data Grid function from the Report ribbon to display a visualization's raw results in the canvas.
Split the canvas horizontally or vertically and show the raw results beside the visualization you've built.
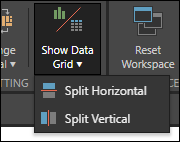
- From the Home ribbon, click the Show Data Grid button to split the canvas horizontally and display the visual's raw results beneath the visual, or
- Click the Show Data Grid dropdown menu and specify how the canvas should be split (horizontally or vertically)
- You will be able to right click on the raw results table to open the context menu and interact with the table, as with other visuals
- The raw results table will be saved in the data discovery alongside the visualization
- When a data discovery that s shows the raw data grid is added to a presentation or publication, the raw results will not appear in the presentation or publication
- Remove the table of raw results by clicking the Show Data Grid button again to disable it